
SUMMARY
At this point in the economy, stock market growth is unlikely without earnings breaking out of its two-year lull.
In this edition, we will cover the most significant drivers indicating the current status of the market. Second, we will offer a Strengths, Weaknesses, Opportunities, and Threats analysis of the Capstone investments.
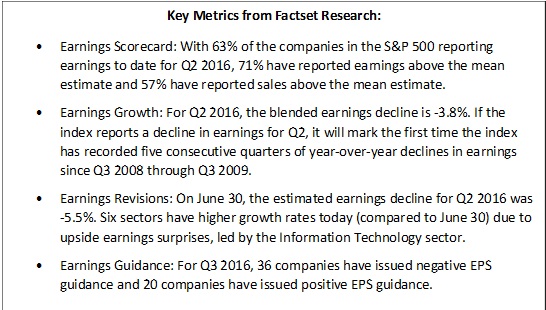
CORPORATE EARNINGS
If earnings meet expectations, we can expect a decline for the fifth consecutive quarter. The decline in earnings is led by a drop in revenue that — if persistent in the second quarter of 2016 — will be the sixth consecutive quarter of declines (Source: Factset).
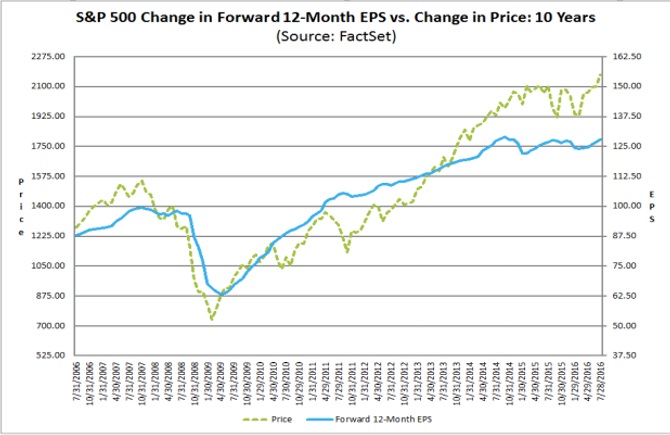
While on recent upturn, expected earnings (blue line) have been in an overall decline since July 2016 (below). In total, earnings have been range-bound (see the orange parallel lines below.)
ECONOMICS
The economy is growing at a rate that is below average. Industrial production is leading a decline. After being up through April, the industrial production began to sink in May.
Employment is the strongest contributor to the economy. Most recently, nonfarm payrolls reported for June were stronger than expected. Even with the solid monthly showing, employment growth has been slowing down the last six months.
Consumption and housing are more tempered. Housing began to fall with an annualized rate of 1,164,000 units, down from 1,167,000 in April. At this time, the three-month trend for sales, production, consumption, housing and employment are all down.
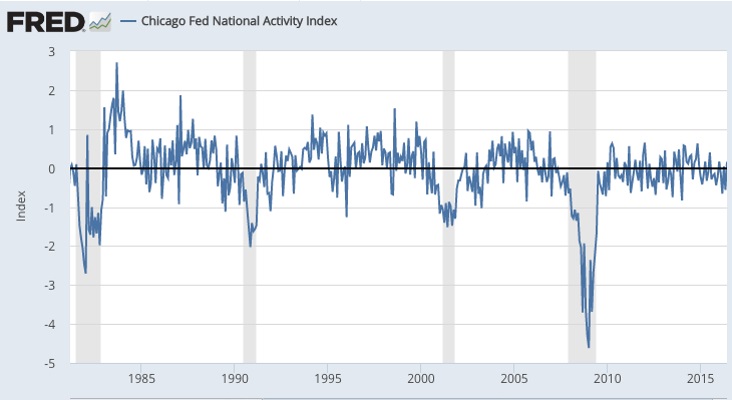
A report by the Chicago Federal Reserve based on national activity has indicated that growth has been in a slump since December of 2014.
TECHNICALS
The S&P 500 has broken out and reached a new all-time high. The strength is supported overall by the internal market action as the percentage of companies above their 200 day moving average is higher than 60%. A secondary look at internals indicates that the market is being led higher by defensive stocks. Typically, a move higher is led by more growth-oriented sectors. The defensive sectors include consumer staples, utilities, gold and precious metals, and US bonds.
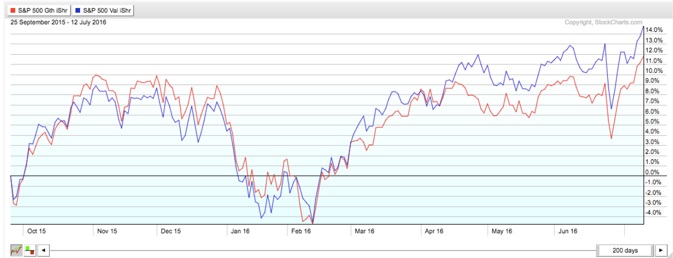
MOMENTUM
Below is the momentum from Value (red) stocks as they began to outperform Growth (blue) stocks.
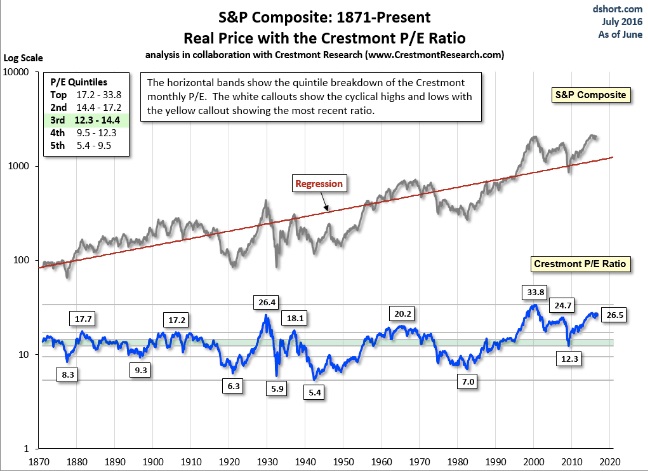
VALUATIONS
Whether above trend, or based on trailing corporate earnings, the market (as measured by the S&P 500) appears to be expensive. Reports by Doug Short and Crestmont Research (below) show individual valuations are high, allowing for little price appreciation potential.
TRENDS
So far this year, the market has been driven by dividend yielding stocks. The SPYDER Dividend ETF is outpacing the S&P 500 18.7% to 6.3%.
While earnings and/or valuations — the two biggest drivers of stock prices — would suggest little upside, the overall trend and technical jump into new highs solidly supports a rising market. We can’t say it will last, but as the saying on Wall Street goes… “The trend is your friend.”
Portfolio Notes
The foregoing comments represent the general investment analysis and economic views of the Advisor, and are provided solely for the purpose of information, instruction and discourse. Only comments in the Portfolio Notes section relate specifically to the Capstone Portfolios and the investment positions.
ETF PORTFOLIOS (Aggressive, Growth, Moderate, Conservative and Income)
The Aggressive, Growth, Moderate, Conservative and Income portfolio returned -1.1%, 0.2%, -0.3%, -0.6% and 1.7%, net of fees over the last 12 months. The S&P 500 (with dividends) increased 5.4%, the DOW (an index of 30 companies) rose by 6.6%, and the Lunt Capital 7Twelve Index saw an incline of 4.2%. The Lunt Capital 7Twelve Index is a diversified, strategic allocation across seven broad asset classes and 12 underlying indices.
The difference is a story of faster ascents after a market decline. At the start of 2016, the S&P 500 experienced a decline of 11.6% while the Aggressive model was down 10%. However, from the end of February to July 31, the S&P 500 ascended by 19%, the Aggressive model increased, and the ETF models all experienced progress, with Growth up by 13%, Moderate up 12%, and Conservative rising by 14%.
The drag in the rebound is a result of the different holdings between the S&P 500 and the ETF models. First, holding Biotechnology — the workhorse of the portfolio with a previous incline of 47% over the past two years — declined 28% from October 2015 to February 2016. Second, the semiconductors of energy and retail have been the strongest industry groups within the S&P 500, though we have not held either of these industries (some exposure to semiconductors is held within the NASDAQ 100).
Lagging over the last year are the IQ Merger Arbitrage (MNA) up 1.7%, the NASDAQ 100 index (QQQ) of mostly technology stocks with a gain of 4.5%, and the S&P Growth Index (IVW) up by 5.1%. These three holdings accounted for roughly 25% of the portfolio.
Adding strength to the portfolio were three holdings: iShares Cohen and Steer REIT (ICF) up 21.9%, SPDR Consumer Staples (XLP) with an incline of 11.3%, and iShares Edge MSCI USA Quality Factor (QUAL) up by 6.6%.
The holding of bonds has been a net positive to the portfolio. Albeit in hindsight, holding longer-dated bonds with 20- and 30-year durations would have been even better as interest rates have declined over the last 12 months, thereby raising the price of all bonds.
Two trades that have worked well since the beginning of March (when the market was down) were the purchase of VanEck Vectors Gold Miners (GDX) and SPDR Utilitites (XLU). These holdings increased by 53% and 10%, respectively. However, holding just 7% of GDX and 5% of XLU weighed down the portfolio. Upping them to a full allocation of 15% each would have added growth to the portfolio.
Analyst Upgrades declined 1.9%, while the S&P 500 increased by 5.4% in the last 12 months. The decline in January clearly impacted this portfolio. As of now, the rebound is mimicking the S&P, but is not strong enough to catch up to the S&P at this time.
Drilling and mining hurt Analyst Upgrades with declines from ENSCO PLC (ESV), falling by 51%; FREEPORT-MCMORAN INC (FCX) down 26%, EQT CORPORATION INC COM (EQT) dropping 21%, and EOG RES INC (EOG) down 22%. Additionally, financial holdings such as Huntington Bancshares (HBAN) declined 11.9%, Northern Trust (NTRS) fell by 9.6%, and Legg Mason (LM) experienced a decrease of 8.1%.
Strengths came from HEWLETT PACKARD CO (HPQ) up 71%, Nvidia (NVDA) rising by 45%, DOLLAR TREE STORES INC (DLTR) with an incline of 23%; DOW CHEM CO (DOW) up 14%, and Duke Energy (DUK) climbing by 9%.
Analyst Momentum declined 19.8% versus the S&P 500 gain of 5.4% over the course of the last 12 months. Similar to what the Analyst Upgrades experienced, the decline in January was torturous, and the rebound is not yet benefiting the Analyst Momentum portfolio.
Losses were led by CENTURY ALUM CO (CENX) down 19%, FIDELITY NATIONAL FINANCIAL IN (FNFV) dropping 15%, MARATHON PETE CORP COM (MPC) falling by 18%, PBF ENERGY INC (PBF) down 20%, and TRIUMPH GROUP INC (TGI) declining by 21%. Certainly, buying into energy stocks was like catching a falling knife; they continued to decline even further rather than increasing.
Strengths were found in Grief Brothers Corp, with a gain of 21.5%, APOLLO EDUCATION GROUP (APOL) up by 23%, CST BRANDS INC COM (CST) rising by 15%, JOY GLOBAL (JOY) up 16%, and Aarons (AAN) climbing by 7%.
Focused Strength gave up 8.4% in the last 12 months as the S&P increased 5.4%. Holding bonds has saved the account in the downturn, but with the rebound in March, the Focused Strength portfolio has been left behind. Currently, 50% of the holdings are in iShares Barclays 20-year bond (TLT), which has risen by 9%. The other 50% is in PowerShares Commodity Index (DBC), currently down by 2.3%.
MaxBalanced is up 1.5% over the last 12 months versus the Lunt Capital 7Twelve Moderate Index up 4.2%. The MaxBalanced portfolio is Capstone’s most diversified portfolio and is structured like a university endowment; investing in more than 12 asset classes. The idea behind this investment is that we cannot predict the market, nor can we accurately forecast how assets are measuring up at any given point.
Most assets outside the US are weak and continues to be reflected in the MaxBalanced fund. The weakest of the assets are WisdomTree International High Dividend (DTH) down 21.7%, iShares Malaysia (EWM) with a drop of 21%, WisdomTree Japan falling by 21%, Guggenheim Multi-Asset Income ETF (CVY) declining by 23%, and PowerShares Global Agriculture Portfolio (PAGG) down 20%. The few strengths in the portfolio are coming from Consumer Staples Select Sector SPDR ETF (XLP) up 22%, and Schwab U.S. REIT ETF (SCHH) rising by 19%.
Equity Income is down 0.9% over the last 12 months versus the S&P 500 with dividends up by 5.4%. The goal of the Equity Income portfolio is for a total return over a three-to-five year investment horizon. Performance has been hit with allocations to Cameco (CCJ) and Honda Motor (HMC), down by 20.4% and 5.2%. Strengths are supported by Reynolds American, up by an impressive 108.6%, Altria (MO) up 87.2% and Crawford & Company (CRD.A) rising by 56%.
Earnings Momentum is up 3.3% over the last 12 months versus the S&P 500 with dividends climbing by 5.4%. The philosophy of the Earnings Momentum portfolio is to invest in companies with good or improving return on capital, and to acquire management teams that make good decisions about the resources they have, all while stock is selling at a reduced priced relative to generated cash flow. Strengths in the Earnings Momentum came from Constellation Brands (STZ) with an increase of 220%, Fiserv up by 131%, and Equifax (EFX) rising by 120.1%.
Constellation Brands has improved by accelerating earnings through accretive acquisitions, and is certainly overvalued as a result of the great rise. However, in terms of earnings, we have no reason to sell the holding. Both Fiserv and Equifax have benefited from increased use of data technology in the financial services industry. Earnings have improved well for both companies. Similar to Constellation Brands, Fiserv and Equifax are both overvalued, but fundamentals don’t warrant selling at this time.
For more information about your investments, please contact your financial professional.
The Analyst Upgrades, Analyst Momentum, Target 2015 Conservative, and Bond ETF programs are based on Ready –to-Go Folios selected by Capstone to meet specific objectives of investors. Detailed information on these programs is available from Folio. Prior to 4/1/15, the MaxBalanced program was managed at a predecessor firm but using the same methodology and by the same manager. The performance reported above is model performance reflecting how the programs were actually traded but without any deposits or withdrawals as would be typical in an actual account. The returns are in U.S. Dollars and include reinvested. Past performance is no guarantee of future performance. There can be no assurance that a client’s investment objective will be achieved or that a client will not lose a portion or all of his or her investment. All returns are in time-weighted total return and include dividends. If a dividend is declared but not paid out in that month, then the returns from a previous month may be adjusted higher to account for the dividend payment.
For a list of all recommendations made over the past 12 months, please contact CIFG.