This article was originally posted on October 2013 on AUM in a Box. This blog entry has been updated with new data through the end of December 2015.
Last week the Consumer Price Index (CPI) was released by the Bureau of Labor Statistics, stating that “over the last 12 months, the all-items index increased 0.7% percent before seasonal adjustments.”
As an update, the Economist Big Mac price in the U.S. came in at $4.93, up $0.14 from $4.79 in January 2015. This represents a 12-month change of 2.9% and is a representation of typical inflation; however, this is certainly greater than the Bureau of Labor Statistics’ measure of inflation.
The rise in the price of a Big Mac is occurring faster than the official rise in consumer prices and has been this way since the late 90s. In 1998, the average price of a Big Mac was about $2.50. As of January 9, 2016, The Economist reports that the average Big Mac now equals $4.93. If we were using the Consumer Price Index (CPI), the price of a Big Mac today would be about $3.80 (see the graph below). The price hikes represented by this popular burger will impact individuals more than the saturated fat content the Big Mac bears.
The rise in the price of the Big Mac foreshadows how the printing of money is eroding the financial system’s arterial walls. The impact is broad-based:
- Each dollar we own is buying less
- For individuals relying on Social Security, the compensation for inflation is not keeping up with the prices people actually pay
- The price of bonds would be much lower if interest rates fully accounted for the rise of inflation based on the Big Mac
- The official economic growth rate would be lower today if prices were based on the Big Mac Index
Using the Big Mac Index to Measure Inflation
The Economist Newspaper created the Big Mac Index in 1986. It was designed to compare the price of currencies between different countries. The index is based on a theory called purchasing-power parity. This theory looks at the same basket of goods in each country and then adjusts for the interest rate one would pay for a loan or receive with a savings account. This adjustment for interest rates makes the price of a Big Mac comparable in each country. The Big Mac Index has just one item; however, because it contains beef, dairy (cheese), wheat (bun), cost of labor, and the cost of real estate, we believe it is a good representation of prices in the United States and abroad.
Rather than use the Big Mac Index for comparing the value of currencies between countries, we wanted to take the price of the Big Mac each year within the U.S. to see how it changes over time. You could also use this approach to look at the trend of prices for other countries as well.
By graphing the trend of the Big Mac Index each year since 1986, we are shown that prices have accelerated much faster than the official reported Consumer Price Index (CPI) from the Bureau of Labor Statistics. On the BLS’s website, CPI is defined as “a measure of the average change over time in the prices paid by consumers for a market basket of consumer goods and services. The basket includes food & beverages, housing, apparel, transportation, medical care, recreation, education & communication, and other goods & services.” However, there are two broad concerns with the CPI. First, CPI accounts for the substitution effect whereby if the price of beef increases, it is assumed that fewer people will buy beef and will instead buy chicken. Second, there is a “chained” effect, meaning the basket of goods isn’t consistent from one time period to the next. The reason for this is that it is believed people change their spending habits as prices change, which is why the Bureau of Labor Statistics instituted this policy.
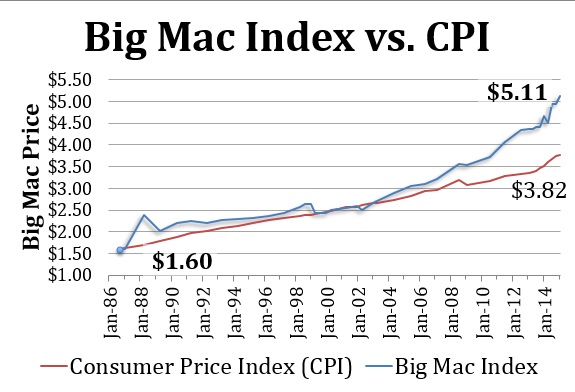
Since 1986, the price of a Big Mac has increased by 208% from $1.60 to its current price of $4.93. During this same time period, the Consumer Price Index has increased at a much lower rate of 116%. More disconcerting is the effect of aggressive adjustment of monetary policy by the Federal Reserve, which began in 1999. This policy shift started with the Asian crisis and Long-Term Capital Management, followed by the Internet bubble, housing bubble, Great Recession, and now the “New Normal” of zero federal funds rates and quantitative easing. In the context of these federal policies, the rate of price increases for the Big Mac is almost three times greater than the official Consumer Price Index.
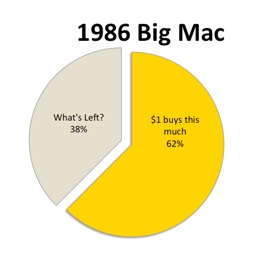
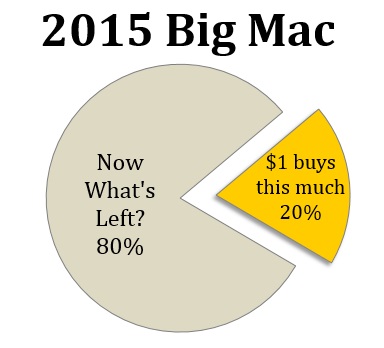
In 1986, $1 would have purchased over half of a Big Mac. Today, you would have to cut the Big Mac into three pieces and only eat one of these bites to get your dollars’ worth. Consequently, each dollar we have is buying a lot less.
Hidden Cuts to Benefits
Individuals on Social Security are provided a cost of living index. This index is based on the Consumer Price Index. If an individual received $1,000 per month in 1999, they are receiving $2,164 today. In contrast, if the Big Mac Index were used, beneficiaries would receive $3,081. By using the Consumer Price Index, the government is paying out $917 less than they would otherwise pay based on the rise in price of a Big Mac. Throughout history, it has always been much easier for governments to quietly inflate away their excess liabilities rather than attempt outright cuts and painful austerity. The streets of Europe are a present-day example of the social difficulty of outright cuts. By understating inflation, the federal government is effectively reducing the amount owed to retirees and thereby cutting the long-term deficit.
Bond Prices and Inflation
The price of bonds should reflect the rate of inflation. Ed Easterling, founder of Crestmont Research, links inflation to the estimate of interest rates. By printing money to buy bonds, the government has pushed the interest rate of a 10-year government bond down to about 2.0%. However, Easterling points out that the 10-year government bond rate should be about 1% above inflation. The current rate of inflation reported by CPI is 0.7%. Adding 1% for the increased risk of holding a bond for 10 years gives you a rate of 1.7% using official inflation estimates. The current interest rate of a government bond is 2.0%, but if we were to account for inflation based on Big Mac prices, the 10-year government bond rate would increase from 1.7% to 3.9%, and bond indices would decline by about 16%. In other words, in the long run, 10-year government bonds are overvalued by about 16% primarily due to persistent intervention (manipulation) by the Federal Reserve.
Propping Up GDP Numbers by Underestimating Inflation
Lastly, Gross Domestic Product (GDP) is the measure used for the growth rate of the overall economy. GDP is adjusted for inflation. An understatement of assumed inflation makes the reported GDP headline number look better. Conversely, an overstatement makes the calculated growth rate look worse. Over the last few years, using a higher CPI has benefited GDP reports. Using the Big Mac Index instead of the official CPI would reduce GDP growth rates. With little or no growth from the price of the Big Mac or the CPI, we find that inflation overall has impacted GDP very little in the last year. Further, GDP has had an insignificant impact from other components as the Bureau of Economic Analysis (BEA) reported that for the first quarter of 2015, the economy was growing at a 2.0% annualized rate.
In the last 13 years, three bubbles have emerged; each funded by the government artificially lowering interest rates and printing money. Each subsequent contraction has been worse than the last. Why should this latest bout of artificial growth — which is even steeper than the previous three — end differently?
Implications for Investors
There are two main implications to point out. First, individuals need more income to sustain the same level of consumption they have had in the past. Second, Easterling believes that the value of the stock market is predicated on the level of inflation. However, if inflation is higher — or lower — than what is reported, does that make valuations of the stock market more unstable than they already are?
Recently, Easterling wrote in “Nightmare on Wall Street: This Secular Bear Has Only Just Begun”:
“Now, finally, the stock market is fairly-valued for conditions of low inflation and low interest rates (assuming average long-term economic growth in the future). But what about the future? If inflation remains low and stable indefinitely, then this secular bear will remain in hibernation until the inflation rate runs away in either direction.” (Updated February 4, 2015)
What if inflation is already above the level to support heightened valuations for the stock market? Does that mean that the stock market could lose its lofty stance even quicker?
Certainly this is a possibility and further justifies ongoing tracking of the Big Mac as the inflation measure of choice for financial advisors to use with your clients.